
- November 3, 2026
- Posted by: Dave Kurlan
- Categories: Analogies, Baseball and Sales, Sales Pipeline and Forecast, Understanding the Sales Force
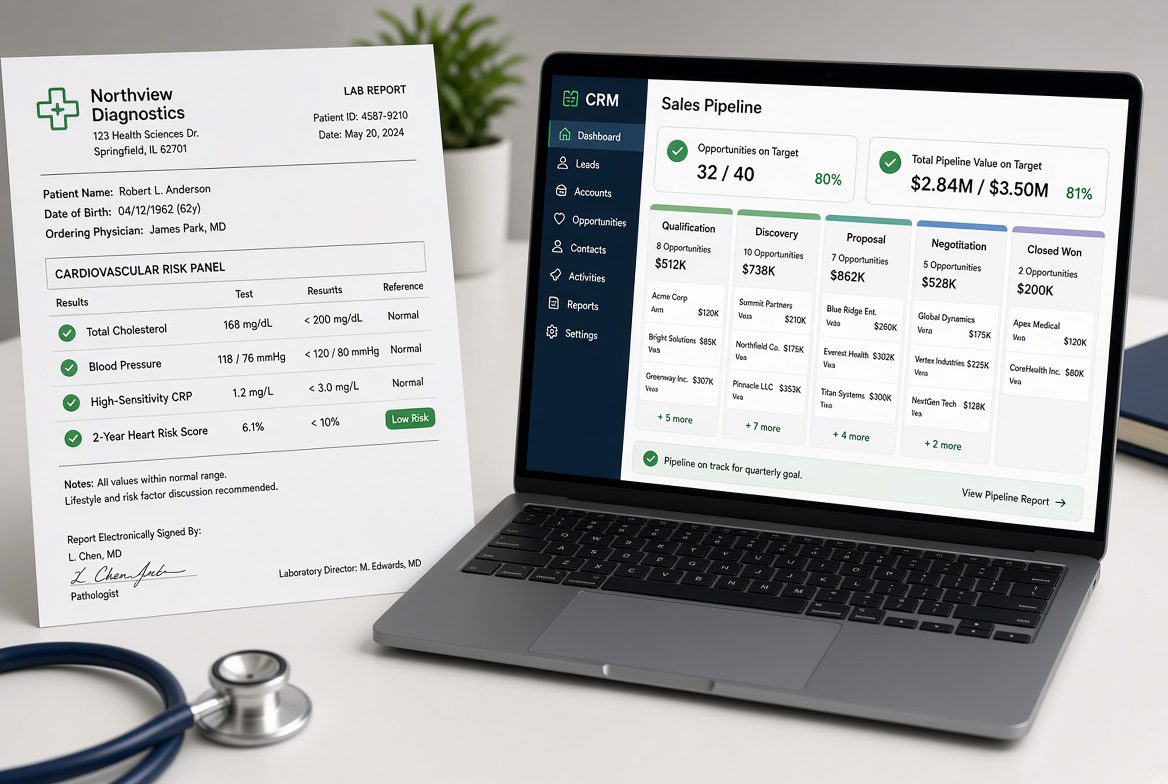
My latest blood work showed the numbers that every guy my age wants to see.
✅ The genetic risk factor for heart disease was low.
✅ Cholesterol and the other blood-fat numbers were all clean.
✅ The inflammation marker was low.
✅ Blood pressure was normal.
✅ The two-year predictive model for heart attack or stroke came back looking pretty freakin’ awesome.
There’s just three problems.
❌ I’m not twenty-five
❌ I’m carrying much more weight than I should be,
❌ I’ve already got coronary artery disease.
Those three facts don’t care what the lab report says. The numbers I was staring at were real, but they were missing some important context.
Your pipeline can pull the same trick.
✅ Number of opportunities on target.
✅ Total pipeline value on target.
✅ Everything the CRM is designed to show you is flashing green.
Then you look closer and the picture changes because the context for those numbers changes.
🧨 In one scenario the opportunities and values are on target, but a deep dive shows the reps scored them very optimistically. Stages, probabilities, and expected close dates all look better than the actual conversations support. The dashboard reports a healthy pipeline. The opportunities themselves don’t support the score.
🧨 In another scenario where the opportunities and values are on target, the impactful ones are all six to twelve months out. Those future deals count the same as the ones that could close this quarter. The dashboard doesn’t flag the timing. It just adds them up and shows a number that looks sufficient.
🧨 In a third scenario where the opportunities and values are on target, the close rate has been trending down significantly. The same volume of pipeline will produce much less revenue than it did last year. The report still shows the pipeline is “on target.” It doesn’t show the lower yield.
🧨 And then there’s the scenario I have witnessed most often this year: opportunities and values appear acceptable, but average deal size is down sharply—sometimes by as much as 75%—and the close rate and the number of opportunities never rose enough to offset it. The pipeline total didn’t collapse. The revenue it can produce did.
These aren’t rare.
They’re what happens when you treat the top-line pipeline numbers as predictive. The CRM is built to count opportunities and add up their values. It is not built to ask whether the reps scored them realistically, whether the timing is actually near-term, whether the close rate still supports the forecast, or whether the deals are the same size they used to be. And even when the reps remove their rose-colored glasses and dampen their enthusiasm, the pipeline still doesn’t measure what the prospects are doing. It only measures the salesperson’s progress.
Of course there’s also the opposite problem—the one that doesn’t fit this analogy at all. The lab report comes back in the red. Oh-oh!
The sales version is not enough opportunities in the pipeline. The numbers aren’t misleading. They’re just bad. In that case I might die, and so will the pipeline. No amount of optimistic scoring, future dating, or close-rate math saves you when the volume simply isn’t there. The dashboard isn’t lying. It’s telling you the truth you don’t want to hear. Most of the time, though, the more dangerous version is the one that looks healthy.
Baseball has the same problem. A hitter can post a respectable batting average while his hard-hit rate and extra-base hits disappear. He’s still putting the ball in play. The box score looks fine. But he’s not barreling the ball.
Sales Pipeline reports do the same thing. They show you the opportunities and the value. They don’t always show you whether those opportunities are real, timely, closeable, or large enough to matter. And sometimes the box score is just empty. That version is obvious. The version that looks okay is the one that gets you.
So the question isn’t whether your pipeline “looks good.” The question is whether the numbers that look good are the numbers that actually predict revenue—and whether the numbers that look bad are bad enough that you have to stop and rebuild.
Are you checking how the reps scored the opportunities, not just that they scored them?
Are you looking at how many of those opportunities are six to twelve months out?
Are you watching close rate trend, not just current pipeline value?
Are you tracking average deal size by quarter, not just total value?
And if the opportunity count itself is short, are you treating that as the emergency it is?
If the only numbers that improved—or stayed on target—are the ones that are easiest to inflate, your pipeline is doing what my lab report did. It’s giving you the good news while the real risk factors are still in the room. If the numbers are in the red, at least the risk is obvious.
A few closing thoughts…
Most CRMs will show you the opportunity count and the total value. They will not indicate whether those opportunities were scored realistically, whether the timing is actionable, whether the details support the forecast, or whether the deals will actually close. You cannot dig into what was never captured.
Even when a CRM lets you capture more granular data, the standard probability fields still treat a fully qualified opportunity the same as one that is unlikely to close or that you cannot win. Both get counted.
How many fully qualified opportunities have you lost?
A sales scorecard, whether built as a stand-alone tool or inside a CRM that supports it, lets you score opportunities on the criteria that actually predict a win, not just the criteria that indicate the opportunity is qualified. Points come from what the prospect says and does, rather than the stage the salesperson moved it to. That provides a second view of the same pipeline, one that is less dependent on optimism and more dependent on evidence.
The dashboard will still show the numbers that look healthy. The scorecard shows whether those numbers are supported by the factors that actually determine whether the deals close.